
Why Brazil and Singapore Beat the US in Overall Digital Engagement
It may surprise you to learn that the U.S. did not top the global charts for digital engagement in PYMNTS Intelligence’s “How The World Does Digital” report. In fact, it came in third. But you may also be surprised at some of the details of U.S. consumer digital engagement, where resources and entertainment are more […]
The post Why Brazil and Singapore Beat the US in Overall Digital Engagement appeared first on PYMNTS.com.
It may surprise you to learn that the U.S. did not top the global charts for digital engagement in PYMNTS Intelligence’s “How The World Does Digital” report. In fact, it came in third.
But you may also be surprised at some of the details of U.S. consumer digital engagement, where resources and entertainment are more readily available than anywhere else on the globe. The U.S., after all, hosts most of the world’s most successful digital companies and boasts one of the highest GDPs. As the report shows, nearly all U.S. households have access to high-speed broadband and 4G networks, with over half also accessing 5G.
According to the report, 97.3% of U.S. consumers engaged in at least one digital activity monthly. However, the extent of engagement varies significantly, with only 1.5% participating in digital activities daily and 7.8% weekly. On average, U.S. consumers performed 16.2 digital activities per month, demonstrating moderate engagement compared to other surveyed countries.
But before you can understand the balance of “How The World Does Digital,” a little background about the report is needed.
PYMNTS Intelligence analyzed digital engagement among 67,000 consumers across 11 countries in 2023. It reveals high participation rates with varying levels of engagement based on generation and income. Key findings highlight Brazil’s leadership in digital adoption and emphasize the urgent need for global inclusive digital growth and infrastructure to bridge the digital divide.
The countries surveyed include the United States, the United Kingdom, France, Germany, Italy, the Netherlands, Spain, Australia, Japan, Singapore and Brazil. The sample sizes were statistically representative of the population in each country, considering gender, age, income and education.
To measure digital engagement, the report identified 40 core activities within 11 pillars of digital life, such as banking, shopping and entertainment. Respondents indicated their engagement frequency for these activities (daily, weekly, monthly or not at all). The results were then extrapolated to estimate the number of days consumers engaged in each activity per month. This allowed for a comprehensive comparison across different demographics and countries.
Taking the Bronze
As stated, when comparing the U.S. to the other ten countries surveyed, the U.S. ranks third in overall digital engagement. Brazil leads with an average of 361 activity days per month (equivalent to 12 activities per day), representing 30.1% of the maximum possible engagement. Japan, on the other hand, ranks lowest, with an average of 127 activity days per month (4.2 activities per day), equating to only 10.6% of the maximum.
 One of the most significant areas of digital engagement for U.S. consumers is digital banking and payments. The report highlights that about two-thirds of U.S. consumers use mobile banking (68.6%) or online banking (66.8%) at least monthly. Nearly half (47%) of these consumers engage with mobile banking services weekly, while 42% do so with online banking. On average, U.S. consumers engage in digital banking activities 21.7 days per month, indicating a strong reliance on digital platforms for managing financial transactions.
In a global context, the U.S. ranks third in terms of digital banking engagement among the surveyed countries. Singapore leads, with consumers engaging in digital banking activities an average of 25.2 days per month, followed by the United Kingdom at 23.8 days. The U.S., with its 21.7 days, demonstrates high engagement but still trails behind these leaders.
This high level of digital banking engagement is supported by the extensive digital infrastructure in the U.S. With 99% of the population having access to 4G networks and 97% to 5G networks, consumers can seamlessly integrate digital banking into their daily routines. The availability of various digital payment options, such as mobile wallets (used by 12.5% of consumers for in-store purchases) and contactless cards, further enhance this engagement.
Shopping and eCommerce
Another critical area of U.S. digital engagement is shopping and eCommerce. The report reveals that 24.1% of U.S. consumers shop on online marketplaces at least weekly, and 21.4% engage in online shopping activities. This reflects a growing trend toward eCommerce, driven by the convenience and variety offered by online platforms.
On average, consumers engage in shopping-related digital activities 18.9 days per month. The report shows that 46.7% of U.S. consumers used card-based methods for their last in-store purchase, with only 17% using cash or check, highlighting the preference for digital payment methods.
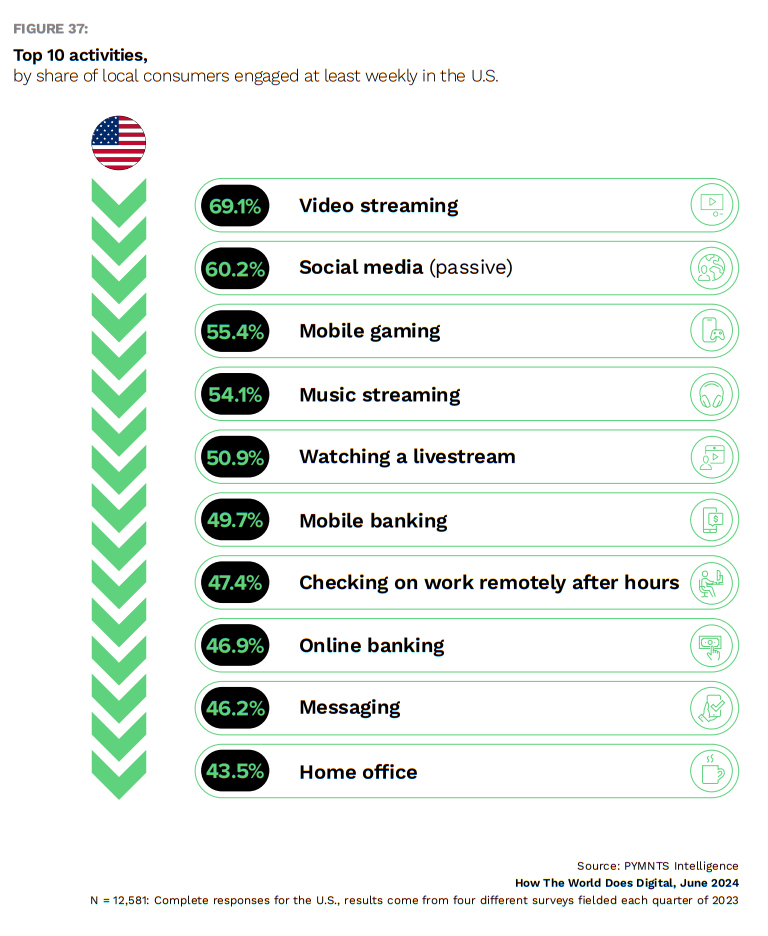
Entertainment and communication are also significant pillars of digital engagement. Video streaming, social media and messaging are among the top activities, with 59.9% of U.S. consumers engaging in video streaming at least weekly. Social media (both passive and active usage) and messaging also see high engagement, with 50.9% of consumers passively using social media and 50.6% actively engaging at least weekly. Messaging apps are used by 50.8% of consumers weekly, reflecting the importance of digital platforms in staying connected and entertained.
Generational and Income Differences
The report underscores notable differences in digital engagement across generations and income levels. Younger consumers, particularly Generation Z and millennials, are more intensely engaged in digital activities compared to older generations.
For instance, Gen Z engages in an average of 23.5 activities monthly, while baby boomers engage in only 9.6. Similarly, higher-income consumers tend to have higher levels of digital engagement, reflecting greater access to digital devices and services. For example, consumers with high income engaged in banking activities 23.8 days per month, compared to 15.4 days for low-income consumers.
It’s here that the U.S.’ digital divide is exposed. The U.S. government is working to improve its digital services by making websites mobile-friendly, accessible and user-friendly. It’s also digitizing services to allow for more online completion of tasks. Some initiatives include Digital Service Playbook, U.S. Web Design System and Technology Transformation Services. There have been positive results like increased user satisfaction and improved accessibility, but challenges include uneven adoption, legacy systems and long-term commitment.
The redesigned Medicare.gov website, with clearer information and search functions, resulted in a 72% user satisfaction increase. Agencies like the IRS are offering more online services, like accessing tax records and making payments online.
The U.S. government is addressing several digital transformation areas besides government services. This includes expanding broadband access, improving cybersecurity, protecting data privacy, promoting digital health, developing smart cities, adopting cloud technologies and investing in artificial intelligence research and development.
In April, the Department of Commerce’s National Telecommunications and Information Administration (NTIA) announced the availability of more than $800 million in funding to states, territories and Native entities. The funding aims to empower individuals and communities with new skills and opportunities to benefit from meaningful access to high-speed internet.
“Access to the Internet is downright essential in the 21st century … once we connect a community to high-speed internet — we need to make sure they can really make the most of that connection,” U.S. Sen. Patty Murray, D-WA, said. “This funding will allow all 50 states to implement the digital equity plans they’ve spent the last year developing — this is another big step toward ensuring that people and communities everywhere can participate in and benefit from an increasingly digital world.”
The post Why Brazil and Singapore Beat the US in Overall Digital Engagement appeared first on PYMNTS.com.